by WCWadmin | Jun 28, 2023 | Science
Arctic Sea Ice in Poor Condition: NASA Worldview Satellite Image Reveals Concerning Sight
The
NASA Worldview satellite image below shows Arctic sea ice in a poor condition on June 16, 2023, all the way up to the North Pole (on the bottom left of the image below). There is open water near the Franz Josef Archipelago, some 1000 km from the North Pole (on the right side of the image below). Clouds prevent a clearer view of the sea ice.
The Uni of Bremen image below shows Arctic sea ice thickness on June 15, 2023.
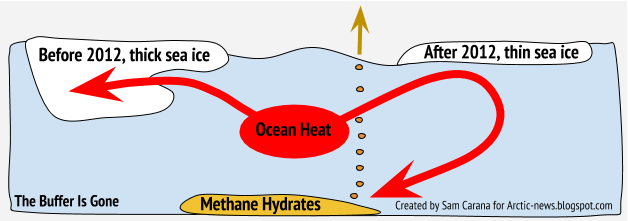
The danger is that, as El Niño strengthens, there will be massive loss of Arctic sea ice over the coming months, with water in the Arctic Ocean heating up strongly due to loss of the latent heat buffer and loss of albedo, while huge amounts of ocean heat keep entering the Arctic Ocean from the Atlantic Ocean and the Pacific Ocean.
Furthermore, the Jet Stream is strongly deformed, threatening to result in heatwaves that extend over the Arctic Ocean and that cause hot water from rivers to enter the Arctic Ocean, while storms accelerate the flow of ocean heat into the Arctic Ocean, and while fires and storms contribute to darkening of the sea ice, speeding up its demise.
All this threatens to trigger eruption of methane from the seafloor of the Arctic Ocean, as has been described many times before, such as in this post, in this post and in this post.
Threatening Tipping Points: Loss of Arctic Sea Ice, Albedo, Latent Heat Buffer, and Methane Eruption Pose Accelerated Temperature Rise and Permafrost Loss Risks
Loss of Arctic sea ice albedo, loss of the latent heat buffer and eruption of seafloor methane all constitute tipping points that threaten to abruptly accelerate the temperature rise in the Arctic, further speeding up loss of permafrost in Siberia and North America and thus threatening to trigger further releases of greenhouse gases.
In addition, there are further events and developments that could unfold and make things even worse.
Temperature Rise and Disruptions: Traffic, Aerosols, and Methane Implications
The upcoming temperature rise on land on the Northern Hemisphere could be of such a severity that much traffic, transport and industrial activity will grind to a halt, resulting in a reduction in cooling aerosols that are now masking the full wrath of global heating. Without these cooling aerosols, the temperature is projected to rise strongly, while there could be an additional temperature rise due to an increase in warming aerosols and gases as a result of more biomass and waste burning and forest fires. Furthermore, as traffic slows down, there will be less nitrogen oxide emissions, which could result in less hydroxyl to curtail methane.
The bar on the right depicts the threat, as discussed at the Extinction page.
In conclusion, the situation is dire and calls for support for a Climate Emergency Declaration.
Links
• Arctic sea ice under threat – update 1
• NOAA – The National Centers for Environment Prediction Climate Forecast System Version 2
• NOAA – Climate Prediction Center – ENSO Diagnostic Discussions
by WCWadmin | Jun 23, 2023 | Science, World Health
Introduction:
The Arctic region plays a critical role in the Earth’s climate system, with its sea ice acting as a vital component. However, in recent years, the Arctic sea ice has been facing significant challenges due to various factors linked to climate change. This update sheds light on the current state of Arctic sea ice and the implications for the environment and global health.
The World daily 2-meter Air Temperature (90-90°N, 0-360°E)
The World daily 2-meter Air Temperature (90-90°N, 0-360°E) was 16.77°C on June 9, 2023, an anomaly of 0.9°C for that day. The highest temperature on record is 16.92°C, and it was reached on August 14, 2016, and the anomaly for that day was only 0.75°C.
The record high of 16.92° actually was a tie between August 13, 2016, August 14, 2016, and July 24, 2022. That latter date is important, since the record high temperature was reached even while there was a strong La Niña, suppressing the temperature. This time, we’re in an El Niño, so we can expect even higher temperatures over the next few weeks.
The highest anomaly on record was reached on February 28, 2016, when there was a strong El Niño and the anomaly was 1.15°C. Note that these anomalies are compared to the mean temperature for that day in NOAA’s NCEP CFSv2.
The above image, from an
earlier post, uses monthly NASA Land+Ocean temperature anomalies
versus 1886-1915 that are further adjusted by 0.99°C to reflect ocean air temperatures, higher polar anomalies and a
pre-industral base.
Sea surface temperature on the North Atlanti
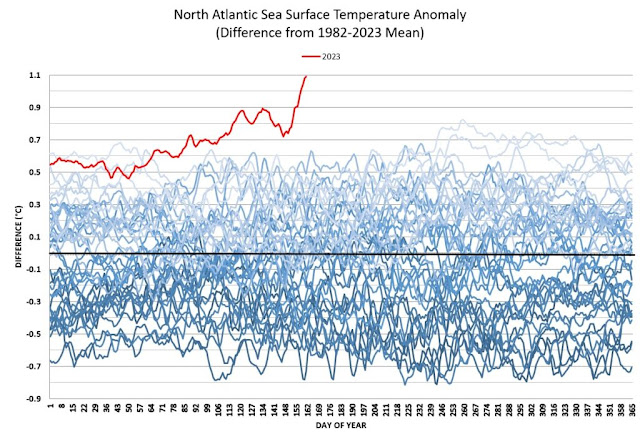
The above image shows sea surface temperature on the North Atlantic (0-60°N, 0-80°W) depicted as anomalies, reaching about 1.1°C above the 1982-2023 mean on June 10, 2023.
The situation is especially critical in the North Atlantic, as vast amounts of ocean heat in the North Atlantic are moving toward the Arctic, threatening to cause rapid melting of Arctic sea ice and thawing of permafrost.
North Atlantic (0-60°N, 0-80°W) reaching 22.7°C
The above image shows the same data for sea surface temperature on the North Atlantic (0-60°N, 0-80°W) reaching 22.7°C on June 10, 2023 (on the black line), 0.7°C higher than the 22.0°C on June 10, 2022 (on the orange line).
The comparison with 2022 is important, as the North Atlantic sea surface temperature reached a record 24.9°C on Sept. 4, 2022, even while there was a strong La Niña, suppressing the temperature. This time, we have an El Niño, as illustrated by the
NOAA image on the right.
The annual Arctic sea ice extent minimum is typically reached in September and the North Atlantic sea surface temperature is critical in regard to melting of the Arctic sea ice. The already high sea surface temperature together with the impact of the El Niño make the outlook for Arctic sea ice for September 2023 look grim.
Sea ice concentration is getting lower in many places and there is open water off the Siberian coast and in parts of the Beaufort Sea and Baffin Bay, as illustrated by the Uni of Bremen image on the right. Rising temperatures in the Arctic threaten to trigger massive loss of Arctic sea ice over the coming months.
The image on the right, from
polarportal.dk, shows very low Arctic sea ice volume for the time of year on June 8, 2023, already much lower than the volume on the same date for any of the four previous years.
The
NASA Worldview satellite image below shows Arctic sea ice in a very vulnerable state on June 11, 2023, even very close to the North Pole (on the left of the image below). Open water is also visible near the Franz Jozef Archipelago, some 1000 km from the North Pole (on the right of the image below).
The NASA satellite image on the right provides a closer look at the sea ice near the North Pole on June 12, 2023 (click on images to enlarge).
As discussed in earlier posts such as
this one, conditions are dire:
• Earth’s energy imbalance is at record high
• emissions are at record high
• greenhouse gas concentrations are at record high
• temperatures are very high, especially in the Arctic
• North Atlantic sea surface temperature is at record high
• sea ice is very vulnerable
• the Jet Stream is strongly deformed, threatening to cause:
• hot water from rivers entering the Arctic Ocean, and with
• storms pushing hot water into the Arctic Ocean
On the one hand, it’s terrible to see open water close to the North Pole so early in the year, yet on the other hand, this may enable ocean heat to escape to the atmosphere and thus delay eruption of seafloor methane (image further below).
The image on the right, from the Uni of Bremen, shows Arctic sea ice thickness on June 12, 2023.
The image below shows the extent of the deformation of the Jet Stream on June 6, 2023. No less than 26 circular wind patterns (at 250 hPa) are marked on the image, which also shows sea surface temperature anomalies. The Jet Stream is can also be seen crossing the Equator at the bottom of the image.
“The melting of Arctic sea ice not only affects the environment but also poses significant risks to human health, including mental health challenges, infectious diseases, and limited access to healthcare services.”
Furthermore, there are
circumstances that could coincide in a cataclysmic alignment: El Niño is on the way, sunspots are higher than predicted and the Tonga submarine volcano did add large amounts of water vapor high into the atmosphere.
All this looks set to jointly result in massive loss of Arctic sea ice over the coming months, with loss of the latent heat buffer and loss of albedo threatening to trigger eruption of methane from the seafloor of the Arctic Ocean, as has been described many times before, such as in this post, in this post and in this post.
Both loss of Arctic sea ice and eruption of seafloor methane constitute tipping points that threaten to abruptly accelerate the temperature rise in the Arctic, thus also accelerating loss of permafrost in Siberia and North America that threatens to trigger further releases of greenhouse gases.
In addition, there are further events and developments that could unfold and make things even worse.
The upcoming temperature rise on land on the Northern Hemisphere could be of such a severity that much traffic, transport and industrial activity will grind to a halt, resulting in a reduction in cooling aerosols that are now masking the full wrath of global heating. Without these cooling aerosols, the temperature is projected to rise strongly, while there could be an additional temperature rise due to an increase in warming aerosols and gases as a result of more biomass and waste burning and forest fires. Furthermore, as traffic slows down, there will be less nitrogen oxide emissions, which could result in less hydroxyl to curtail methane.
The bar on the right depicts the threat, as discussed at the Extinction page.
In conclusion, the situation is dire and calls for support for a Climate Emergency Declaration.
In the video below, Jim Massa is interviewed by Sandy Schoelles about the changes taking place in the oceans.
Links
• Climate Reanalyzer – World Daily 2-meter Air Temperature (90-90°N, 0-360°E)
• NOAA – The National Centers for Environment Prediction Climate Forecast System Version 2
• Humans may be extinct in 2026
• NASA – GISS Surface Temperature Analysis
• Pre-industrial
• WTF is Happening? An Overview – by Eliot Jacobson
by WCWadmin | Jun 22, 2023 | Science
The upcoming El Niño
The above image shows a forecast for August 2023 of the sea surface temperature anomaly in degrees Celsius, from tropicaltidbits.com. The forecast shows temperatures that are higher than average (based on 1984-2009 model climatology) for the tropical Pacific region indicative of an El Niño event.
By contrast, the above forecast for November 2022 shows temperatures in the tropical Pacific region that are much lower than average, indicating that we’re still in the depths of a persistent La Niña.
By comparison, the above nullschool.net image shows the sea surface temperature anomaly for August 15, 2022, i.e. less than three months ago, when sea surface temperature anomalies in the tropical Pacific region were similar to what they are now, while anomalies in the Arctic were much higher than they are now.
Moving from the bottom of the current La Niña to the peak of a strong El Niño could make a difference of more than half a degree Celsius, as indicated by the image below, adapted from
NOAA.
The
NOAA image on the right confirms that we’re still in the depths of a persistent La Niña. NOAA predicts a transition out of La Niña from now on. Note that the NOAA forecast goes up to June/July/August 2023.
Sunspots
The upcoming El Niño looks set to coincide with a peak in
sunspots. The peak in sunspots looks set to reach a higher than expected maximum impact around July 2025. An analysis in an
earlier post concludes that the rise in sunspots from May 2020 to July 2025 could make a difference of some 0.15°C.
Accordingly, the impact of the upcoming El Niño could make a difference of more than 0.5°C over the next few years. In addition, there will be a growing impact of sunspots, forecast to peak in July 2025.
Methane keeps rising at accelerating pace
Furthermore, there are a number of events and developments that could additionally speed up the temperature rise, including greenhouse gas emissions that keep rising. Methane is particularly important, due to its high potency as a greenhouse gas, and its abundance has also been growing at accelerating pace over the past few years.
The above image, adapted from
Copernicus, shows a forecast for November 14, 2022, 03 UTC at 500 hPa, with high levels of methane showing up over the Arctic.
The above image shows a peak methane level of 2687 ppb (parts per billion) recorded by the
NOAA-20 satellite at 399.1 mb on November 3, 2022 AM.
The above image shows that recent methane daily averages at Mauna Loa, Hawaii, are between 1900 ppb and 2000 ppb (recent monthly average is above 1950 ppb).

The above image shows that recent methane daily averages at
Barrow, Alaska are even higher, between 2000 ppb and 2100 ppb.
Very threatening is a rise in methane that kept following the trend depicted in the above image, created with WMO 2015-2021 global annual surface mean methane abundances, with an added trend that points at a potential mean global abundance of methane of more than 700 ppm (parts per million) CO₂e by the end of 2026. The image warns that, if such a trend kept continuing, the clouds tipping point could be crossed as a result of the forcing of methane alone.
Further events and developments that could speed up the temperature rise
The rise in methane is alarming and further greenhouse gases also keep rising, such as nitrous oxide, water vapor and carbon dioxide, due to high emissions by people and due to feedbacks that are kicking in, such as forest and waste fires, flooding and further extreme weather events, permafrost loss in the Arctic and reduced carbon sinks. Furthermore, maximum warming occurs about one decade after a carbon dioxide emission, so the full warming wrath of the carbon dioxide emitted over the past decade is still to come, and an extra 0.5°C rise by 2026 seems possible due to carbon dioxide alone.
When including further events and developments, the clouds tipping point could be crossed in a matter of years and even with far less methane than the above trend warns about.
As an earlier post mentions, the upcoming temperature rise on land on the Northern Hemisphere could be so high that it will cause much traffic, transport and industrial activity to grind to a halt, resulting in a reduction in aerosols that are currently masking the full wrath of global warming.
The post points at a recent analysis that finds a stronger impact than previously thought for liquid water path adjustment, which supports the 2016 warning that by 2026 there could be a 1.9°C temperature rise due to a decrease in cooling aerosols, while there could be additionally be a 0.6°C temperature rise due to an increase in warming aerosols and gases as a result of more biomass and waste burning and forest fires by 2026.
Furthermore, the 2016 analysis warns about an additional temperature rise of up to 1.6°C due to loss of Arctic sea ice and permafrost, and associated changes.
When including the temperature rise that has already unfolded from pre-industrial and the impact of all such events and developments, the temperature could rise by more than 10°C over the next few years, corresponding with a CO₂e of over 1200 ppm, which implies that the total temperature rise could be as high as 18.44°C by 2026.
Keep in mind that humans are likely to go extinct with a rise of 3°C, as illustrated by the image below, from an analysis discussed in an
earlier post.
The situation is dire and the right thing to do now is to help avoid or delay the worst from happening, through action as described in the
Climate Plan.
Links
• Tropicaltidbits.com
https://www.tropicaltidbits.com
• nullschool.net
https://earth.nullschool.net
• NOAA National Centers for Environmental Information, State of the Climate: Monthly Global Climate Report for October 2022, retrieved November 16, 2022
• Copernicus methane at 500 hPa, forecast for November 78, 2022, 03 UTC
• NOAA-20 satellite
• When will we die?
by WCWadmin | Jun 19, 2023 | Science
The Arctic Ocean is experiencing alarming signs of overheating, raising concerns among scientists and environmentalists. This phenomenon, attributed to climate change, has significant implications for the delicate Arctic ecosystem and global climate patterns. Studies and research have shown that the Arctic region is warming at a faster rate compared to the rest of the planet.
Rising temperatures have led to the loss of sea ice, which acts as a reflective surface, bouncing back solar radiation into space. With less ice cover, more sunlight is absorbed by the dark ocean waters, causing further warming and creating a feedback loop. The consequences of the Arctic Ocean overheating are far-reaching.
The melting of sea ice affects wildlife habitats and disrupts the delicate balance of Arctic ecosystems. Species such as polar bears, walruses, and seals rely on ice for hunting, resting, and raising their young. As ice diminishes, their survival becomes increasingly challenging.
The warming of the Arctic Ocean also impacts global climate patterns. The Arctic plays a crucial role in regulating Earth’s climate system, influencing ocean currents, weather patterns, and atmospheric circulation. Changes in the Arctic can have cascading effects, leading to altered weather conditions in other regions of the world.
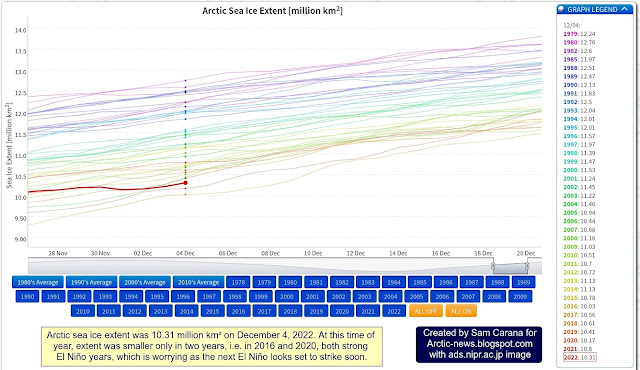
Arctic sea ice extent was 10.31 million km² on December 4, 2022. At this time of year, extent was smaller only in two years, i.e. in 2016 and 2020, both strong El Niño years. With the next El Niño, Arctic sea ice extent looks set to reach record lows.
The NOAA image on the right indicates that, while we’re still in the depths of a persistent La Niña, the next El Niño looks set to strike soon.
The image below shows high sea surface temperature anomalies near the Bering Strait on December 2, 2022, with a “hot blob” in the North Pacific Ocean where sea surface temperature anomalies are reaching as high as 7°C or 12.6°F from 1981-2011. The Jet Stream is stretched out vertically from pole to pole, enabling hot air to enter the Arctic from the Pacific Ocean and from the Atlantic Ocean.
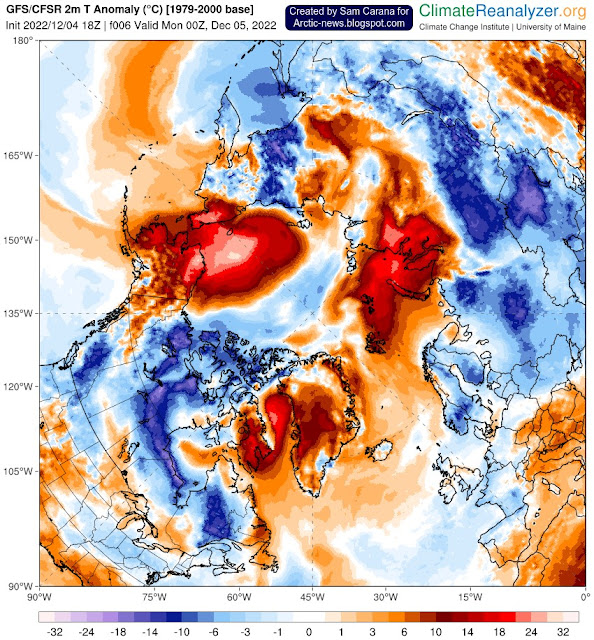
The image below shows a forecast for December 5, 2022, of 2m temperature anomalies versus 1979-2000, with anomalies over parts of the Arctic Ocean near the top end of the scale.
On December 6, 2022, the Arctic was 6.63°C or 11.93°F warmer compared to 1979-2000, as illustrated by the image below.
The image below shows the daily average Arctic air temperature (2m) from 1979 up to December 6, 2022.
Given that we’re still in the depth of a persistent La Niña, these currently very high air temperature anomalies indicate that ocean temperatures are very high and that ocean heat is heating up the air over the Arctic.
Additionally, ocean heat is melting the sea ice from below.Accordingly, Arctic sea ice has barely increased in thickness over the past 30 days, as illustrated by the
navy.mil animation on the right.
This leaves only a very short time for Arctic sea ice to grow back in thickness before the melting season starts again, which means that there will be little or no latent heat buffer to consume heat when the melting season starts.
Furthermore, rising temperatures and changes to the Jet Stream contribute to formation of a freshwater lid at the sea surface at higher latitudes, resulting in further heating up of the Arctic Ocean.
As a result, more heat threatens to penetrate sediments at the seafloor of the Arctic Ocean that contain vast amounts of methane in hydrates and free gas, and result in abrupt release of huge amounts of methane, dramatically pushing up temperatures globally.
The situation is dire and the right thing to do now is to help avoid or delay the worst from happening, through action as described in the Climate Plan.
Links
• Vishop sea ice extent
https://ads.nipr.ac.jp/vishop/#/extent
• NOAA ENSO: Recent Evolution,
Current Status and Predictions
https://www.cpc.ncep.noaa.gov/products/analysis_monitoring/lanina/enso_evolution-status-fcsts-web.pdf
• nullschool.net
https://earth.nullschool.net
• Climate Reanalyzer
https://climatereanalyzer.org
• Naval Research Laboratory – HYCOM Consortium for Data-Assimilative Ocean Modeling
https://www7320.nrlssc.navy.mil/GLBhycomcice1-12/arctic.html
• Albedo, latent heat, insolation and more
• Cold freshwater lid on North Atlantic


